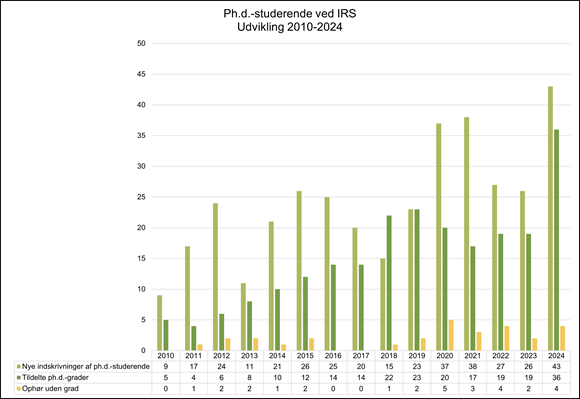
DA / EN

About the department

Key figures

We update our key figures for the number of employees and publications twice a year. You can find the latest key figures here.

  • PhD students: 147
  • Postdoc/assistant professor: 35
  • Part-time lecturer: 45
  • Associate professors and clinical associate professors: 126
  • Professors and clinical professors: 57
  • Other*: 7

In total: 417

  • Adjunct associate professors: 3
  • Adjunct professors: 24

In total: 27


In total - employees and adjunct professors: 444

*Administrative staffs, head of department, etc.

 Bar chart showing the development in the number of employees and adjunct staff at IRS from 2007 to 2026, illustrating a strong and steady growth over time with the highest levels in recent years.

The key figures represent a snapshot, as there is a constant flow of people joining and leaving. Updated February 2026.

Stacked bar chart showing the distribution of men and women by job category at IRS in 2026, including PhD students, postdocs, assistant professors, lecturers, professors, and other positions.

Bar chart showing the overall gender distribution at IRS in 2026, with 255 women and 189 men.

The key figures represent a snapshot, as there is a constant flow of people joining and leaving. Updated February 2026.

Treemap chart showing employee distribution at IRS in 2026, including PhD students, clinical lecturers, lecturers, clinical professors, assistant professors, postdocs, and external teaching staff.

The key figures represent a snapshot, as there is a constant flow of people joining and leaving. Updated February 2026.

Bar chart illustrating the development of PhD students at IRS from 2010 to 2024, including annual numbers of new enrollments, awarded PhD degrees, and withdrawals without degree.

Updated December 2025

Bar chart showing the development in the number of peer-reviewed publications at the Department of Regional Health Research from 2018 to 2025, reported as of January 1, 2026, with an overall upward trend and a peak in 2024.

Pie chart showing the distribution of publications at IRS in 2025, updated January 1, 2026, with 821 publications from the Region of Southern Denmark and 206 from Region Zealand and the Capital Region of Denmark.

Pie chart showing the distribution of publications in 2025 at IRS in the Region of Southern Denmark, updated January 1, 2026, divided among Lillebælt, Sønderjylland, the Danish Hospital for Rheumatic Diseases, Esbjerg, Prehospital services, and Psychiatry at IRS in the Region of Southern Denmark.

Pie chart showing the distribution of publications in 2025 at IRS in Region Zealand and the Capital Region of Denmark, updated January 1, 2026, divided among Holbæk Hospital, SUH, MVH, Nykøbing Falster Hospital, Filadelfia, Psychiatry at IRS Region Zealand, and CTU.

Updated January 1, 2026.


Last Updated 27.07.2024