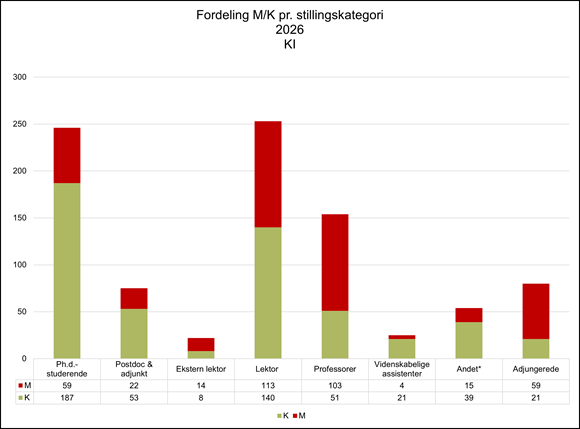
- PhD students: 246
- Postdoc/assistant professors: 75
- Part-time lecturers: 22
- Associate professors and clinical associate professors: 253
- Professors and Clinical professors: 154
- Research assistants: 25
- Others*: 54
Total: 829
- Adjunct associate professors: 7
- Adjunct professors: 73
Total: 80
Employees and adjunct professors at Department of Clinical Research: 909
* Administrative staff, head of department, research assistants, lab assistants, and others

The key figures represent a snapshot, as there is a constant flow of people joining and leaving. The key figures is updated June 2026.
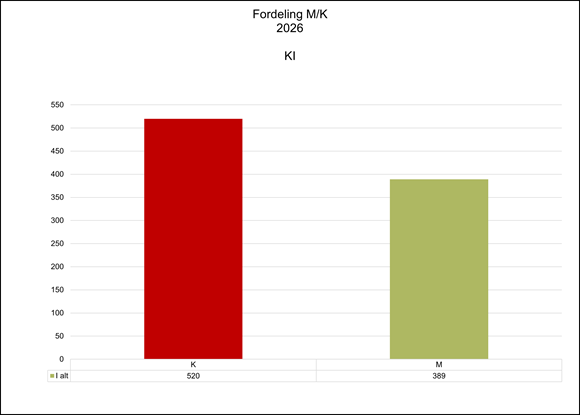
Updated June 2026.

The key figures represent a snapshot, as there is a constant flow of people joining and leaving. Updated June 2026.

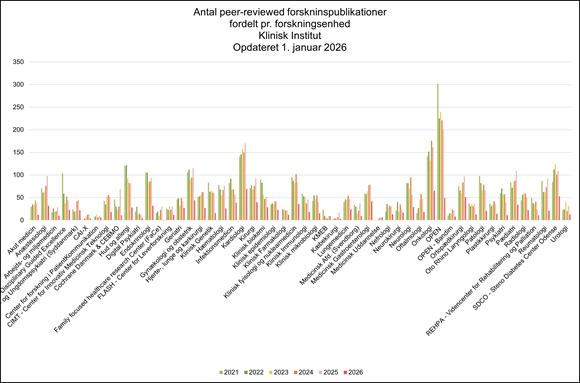
Updated February 2026.
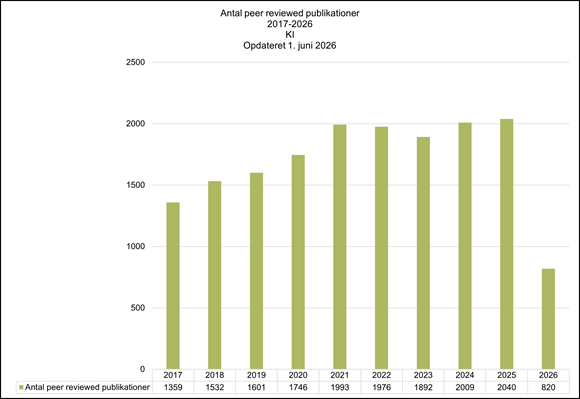
Updated June 1, 2026.
Updated June 1, 2026.